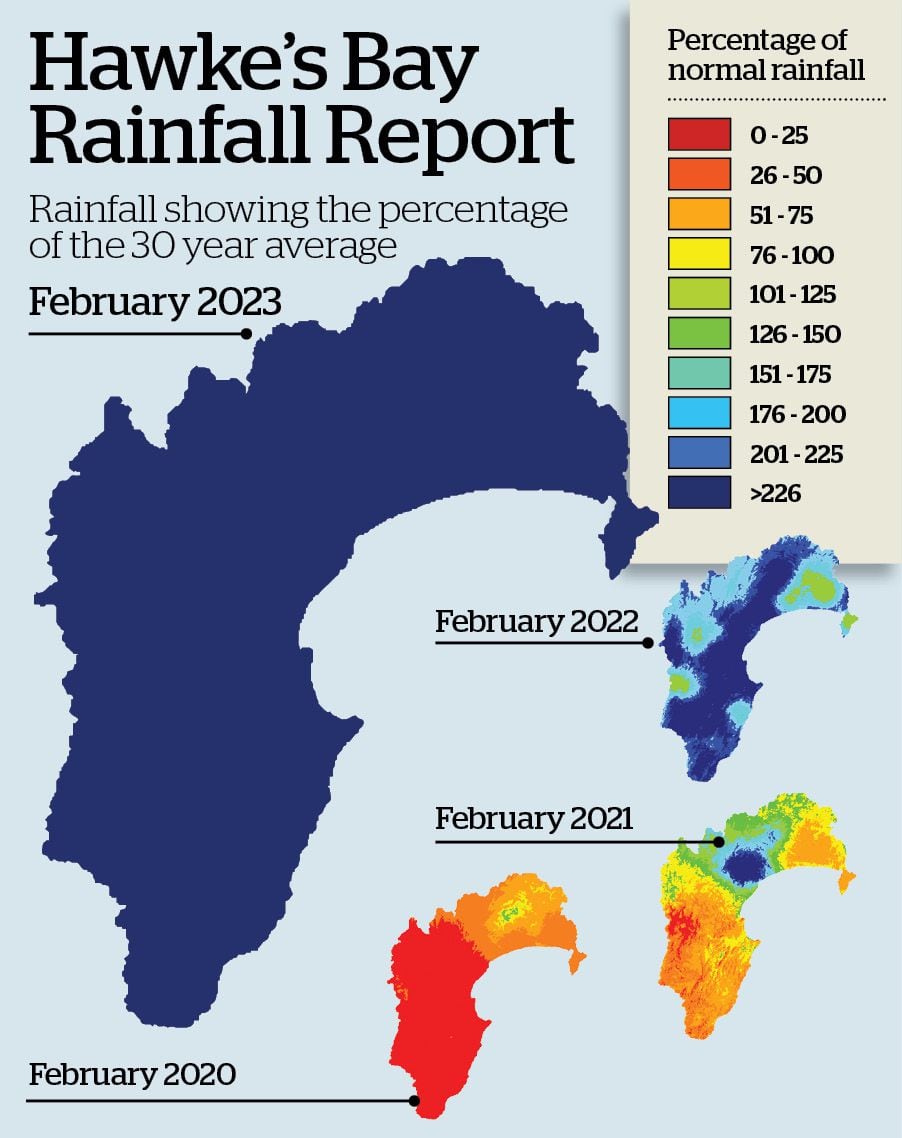
The tale of the tempest which hit Hawke’s Bay last month is being told in Hawke’s Bay Regional Council “maps” which show rainfall was more than nine times the February average in some parts of Hawke’s Bay, and more than double the February average in every corner.
All blue (denoting rainfall of more than 200 per cent compared to the average), one map highlights a deteriorating February weather pattern over the last four years since the near all-red graphic of February 2020, showing rainfall in the month was mainly less than 25 per cent of the average.
On an area basis, Waikaremoana rainfall last month averaged 497 per cent of the average, Northern Hawke’s Bay 362 per cent, Tangoio 627 per cent, Kaweka 358 per cent, Ruahine 373 per cent, the Heretaunga Plains 479 per cent, the Ruataniwha Plains 439 per cent, and Southern Hawke’s Bay 404 per cent.
By contrast, in February 2020, rainfall across Waikaremoana averaged 71 per cent of the average, Northern Hawke’s Bay 52 per cent, Tangoio 12 per cent, Kaweka 15 per cent, Ruahne 8 per cent, the Heretaunga Plains 9 per cent, Ruataniwha Plains 11 per cent and Southern Hawke’s Bay 9 per cent.
Most profound was a total of 510 millimetres at Terapatiki in Waikaremona country – 9.44 times its February average of 54mm, while the greatest on the council’s network was 824mm at Pukeorapa inland from Nūhaka, 3.89 times its February average of 212mm.
Across the council’s network of more than 40 recording stations, from north to south, rainfall averaged more than four times the monthly average.
It also included 756.6mm at Kaiwaka (7.49 times the average), 712mm at State Highway 5 Napier-Taupō stop Te Pōhue, 734.5mm at Glengarry (8.96 times the average), 756mm at Ngarere in the Kaweka Ranges west of Napier (4.06 times the average), and 761.5mm at Waipoapoa in Southern Hawke’s Bay (5.18 times the average).
Among others were the 608.6mm at State Highway 2 Napier-Wairoa road locality Kotemaori (8.45 times the average), 645mm at Ruahine station Parks Peak (3.12 times the average) and 420.4mm at usual Heretaunga Plains summertime rural hotspot Crownthorpe (6.89 times the average).
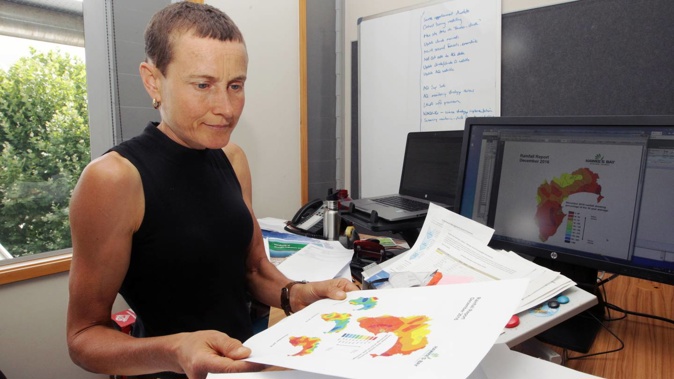
Averages are based on rainfall over the last 30 years, but the council’s team leader for marine air and land science, Dr Kathleen Kozyniak, says that if “this phenomenal rainfall” becomes a regular occurrence, she’ll have to revisit the “band classifications”.
- Live: 'Just the beginning' - Gabrielle's eye on NZ: Heavy winds, monster waves; thousands without power
- The small towns in Gisborne and Hawke's Bay 'desperately in need'
- Cyclone Gabrielle: Transpower grid emergency, substation 'likely underwater'
- This little piggy went to bed, in a flooded muddy bedroom it's claimed as its own
“Currently, it is built on totals being two to three times the average monthly rainfall,” she says in the summary, based on data from rainfall recording stations in the council area stretching from Te Urewera in the north to the Southern Hawke’s Bay coast.
“Some sites approached or hit nine times the average. All sites recorded a new February record, apart from about three.”
Take your Radio, Podcasts and Music with you


