Microbiologist Dr Siouxsie Wiles gives her take on the patterns and trends behind Covid-19 numbers. While there's a lot to be hopeful about, with Omicron surging around the world, she fears this may be "the calm before the storm". Charts prepared by Herald data journalist Chris McDowall
For four months, New Zealand's largest city was locked off from the rest of the country to prevent the spread of Covid-19. Now the border is down and people can enter and leave the region if they are fully vaccinated or show evidence of a negative test.
This is a delicate moment in our collective response to the pandemic. Over the coming weeks, there are several key graphs to keep an eye on. The first shows how many new Covid-19 community cases are reported each day.
The orange bars represent the number of new community cases reported in the Ministry of Health's 1pm update. The red line represents the average number of daily cases over the past seven days. We use this "moving average" to smooth out the day-to-day noise and get a better sense of whether cases are trending up or down.
There are promising signs. Community cases did not explode when Auckland moved to step two of alert level 3. Instead, the numbers tracked up slightly, before levelling out and then declining.
This pattern fits nicely with recent Te Pūnaha Matatini modelling exploring the upper and lower bounds of what might happen under different levels of vaccination. The red case curve line tracks well against the lower bounds of their projection.
The declining case curve tracks well against the lower bounds of Te Pūnaha Matatini's projections. High vaccination rates combined with extensive public health measures seem to have reduced the number of new community cases.
Te Pūnaha Matatini case number forecast from October 28
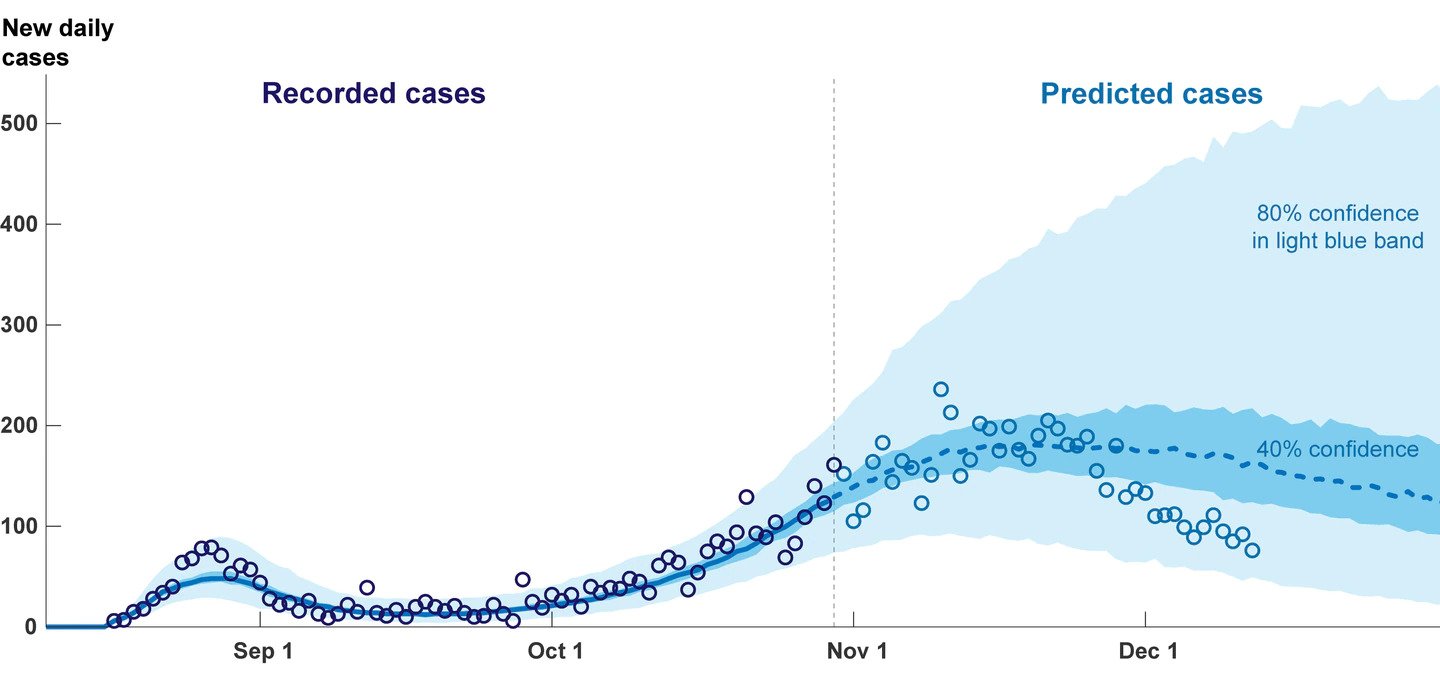
Covid case projections
Source: Te Pūnaha Matatini
Since entering the traffic light system, national case numbers have continued to fall, although it happened at different speeds around the country. Auckland and Waikato DHB daily case numbers dropped quickly. Northland, Waitematā and Counties Manukau held steady for longer, before dropping in recent days.
The traffic light system loosens many restrictions that were in place under alert level 3. Providing they follow certain public health requirements, hospitality, gyms and close-proximity businesses can open. People can gather at private homes in greater numbers.
The impact of these changes on summer case numbers is unknown. Although most parts of the country have high vaccination rates, cases are likely to rise as people resume close social interactions with friends and strangers.
When other countries lifted restrictions it typically took up to a fortnight before case numbers began increasing. This lag means we may only start seeing rising cases at the end of this week.
There is a twist. If the majority of new cases occur among the unvaccinated, we might not even see the rise at first. This happened during the first phase of our Delta outbreak. Testing suggested we had the virus under control and then people started turning up in hospital.
About 94 per cent of eligible people have received at least one Covid-19 vaccination dose. Among the 6 per cent who are unvaccinated, an unknown but significant cohort are distrustful of the medical system and unlikely to get tested.
People who contract Covid but do not get tested are invisible to the health system. Wastewater testing can indicate if Covid is present in a region, but we may not understand the extent of community transmission until people get sick enough to need medical care.
This uncertainty means data about the timing of new hospitalisations is important. Public health officials and researchers will examine it closely. Are we seeing an uptick in hospitalisations among unvaccinated people? Is that a reflection of even higher case numbers in the unvaccinated?
As the year draws to a close, schools will no longer be sites of transmission. The virus will spread in homes, bars, work functions and other places where people come into close contact.
Christmas is a wildcard. Will the holiday seed infection clusters as people move around the country visiting loved ones? Other countries experienced this during 2020, but that was before vaccines were available. The current dip in the case curve may be the calm before the storm — and we don't know how big the storm is going to get.
A key lesson of the past few months is that we have the means to keep cases low. Vaccination is one tool in our toolbox, but the others are important too. This means the appropriate use of masks, socialising in ventilated spaces and social distancing. Moving into summer, we should try to socialise outside as much as possible.
Neglecting these public health measures carries significant risks. New South Wales just recorded a huge Covid spike as restrictions ease across the state. Other places that tried to rely solely on vaccinations have needed to reintroduce restrictions to protect their health systems as case numbers rise.
Keep doing the stuff that we know works well. Socialise responsibly and at a safe distance. Wear a mask. Get tested and isolate if you have any Covid-19 symptoms, even if you are vaccinated.
- By Chris McDowell, NZ Herald
Take your Radio, Podcasts and Music with you