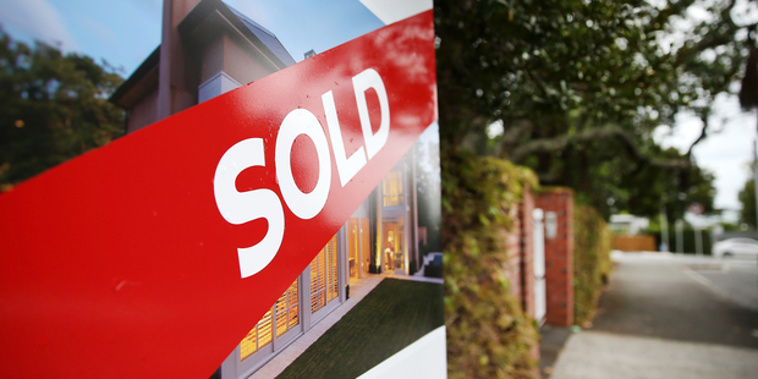
House prices rose in three regional areas but elsewhere activity remains depressed, especially Auckland where sub-$1 million prices prevailed for the third month in a row.
The Real Estate Institute cited rising prices in Waitomo, Nelson and a West Coast area.
Chief executive Jen Baird said there were “glimpses of positivity” in the May data released today.
“Early signs of returning confidence as sales volumes rise in the regions” was the headline on today’s REINZ release.
Waitomo prices rose 53 per cent annually to a $655,000 median, prices in the Grey District centred around Greymouth were up 18.7 per cent with a $400,000 median, and Nelson prices rose 7 per cent annually to $770,000.
Elsewhere, prices dropped.
Northland median prices dropped 2 per cent annually to $715,000, the Bay of Plenty is down 12.2 per cent to $790,000, Waikato is down 7.5 per cent to $740,000, Taranaki is down 16 per cent to $534,000, Gisborne down 9.8 per cent to $600,000 and Hawke’s Bay down 10 per cent to $660,000.
Manawatū-Whanganui fell 12.4 per cent to $528,000 and Wellington is down 11.7 per cent to $795,000.
Marlborough’s median is down 6.8 per cent to $635,000, Tasman’s down 13 per cent to $745,000, the West Coast is down 6.3 per cent to $370,000, Canterbury down 5.4 per cent to $650,000 and Otago’s down 7 per cent to $670,000.
Today’s data is out after ASB said on Tuesday that New Zealand could be “edging closer” towards a housing market turning point with expectations about prospects improving.
The housing confidence survey was headlined “Kiwis edging closer to a housing market turning point” and showed sentiment was up, although ASB noted that was only by a shade.
“With tentative signs of an uptick in housing market activity and moderating price falls evident in the data, predicting the eventual turning point in the market is a common pastime. Similarly, guessing the turning point for the RBNZ – and thus mortgage rates – is a hot topic of conversation with inflation cooling but well above the RBNZ’s target,” ASB said on Tuesday.
A growing portion of Kiwis now think that interest rates might be reaching a peak and a larger minority now think that prices are stabilising or perhaps even set to increase, ASB said.
REINZ said Marlborough, Tasman and Otago had the highest sales count lately. Northland, Auckland, Waikato, Wellington, Tasman, Marlborough and Southland all had a 30 per cent or more rise in sales volumes from April to May.
Auckland’s median fell 10.4 per cent annually and is now $995,000 and that was the third month in a row that it was below $1m.
The REINZ House Price Index showed an annual decrease of 11.2 per cent in the value of residential property nationwide.
Listings volumes fell in all areas except Taranaki and Southland.
At the end of May, there were 26,685 properties for sale, up 250 annually but down 6.8 per cent from April to May.
“Inventory levels look to have stabilised with only a slight increase in stock levels. We have seen low levels of property coming to market across the country for much of this year and, as sales volumes are back at more normal levels, we may be seeing the beginning of a shift in the balance of supply vs demand,” Baird said.
There were 5752 properties sold last month, down from 5776 last May but up 30 per cent from April this year.
New Zealand, excluding Auckland, sales counts increased by 1.4 per cent year-on-year and 26.7 per cent month-on-month.
Most vendors are realistic when it comes to price these days.
“We’ve heard from salespeople that most sellers are meeting the market while others are potentially holding tight on selling at a higher sale price, particularly if they had bought in the peak of the market. These tend to be the properties that stay on the market longer. Easing of loan-to-value restrictions, commentary around peak inflation and a renewed confidence is seeing more first home buyers seek out opportunities,” Baird said.
Nationally, new listings fell 18 per cent from 8983 last May to 7359 listings last month.
Auckland houses take a median 46 days to sell, above the 10-year average of 40 days.
“Across Auckland, buyer activity has been light. Local salespeople say this is largely due to general economic conditions, the weather, and the anticipation of the upcoming election later in the year,” Baird said.
In South Auckland, the number of first-home buyers increased due to the easing of loan-to-value restrictions, and assistance from Kāinga Ora.
“Many vendors are still finding it difficult to adjust their price expectations and open homes have had an uptick in numbers in most parts of Auckland, weather permitting. Auckland salespeople stay hopeful that the recent changes to loan-to-value restrictions and stabilising interest rates will have a positive impact on market activity soon,” she said.
Auckland City’s median price last month was $1.02m, Franklin’s $940,000, Manukau $945,000, the Shore’s $1.1m, Papakura’s $829,000, Rodney’s $1.1m and Waitakere $928,000.
Anne Gibson has been the Herald’s property editor for 23 years, having won many awards and covered property extensively.
Take your Radio, Podcasts and Music with you


